Struggling with mysterious app crashes or slowdowns? We’ve all been there – you hit “Run” and the app bombs out, or the emulator freezes and you’re left ready to throw your laptop. Don’t worry, debugging doesn’t have to drain your soul. In this guide, we’ll fix those issues together with 10 essential Android Studio debugging tips. By the end, you’ll know how to squash bugs faster and get back to coding with a smile.
Android Studio Debugging Tips 1: Run in Debug Mode & Set Breakpoints
The first step to effective debugging is using Android Studio’s Debugger. Instead of just running your app normally, run it in Debug mode so you can pause and inspect what’s happening. Set breakpoints (just click on the gutter next to a line number) where you suspect issues. When you run with the debugger (the bug icon or Shift+F9 in Windows), the app will pause at your breakpoint, letting you investigate. Android Studio’s debugger lets you “select a device, set breakpoints in your code, and then examine variables and even evaluate expressions at runtime“. This means you can freeze the app right before that crash and see exactly what’s going on under the hood.

Why it helps: Breakpoints act like stop signs in your code. Instead of guessing what your code is doing, you pause execution at critical points. Once paused, you can check if your variables have the values you expect, or if a certain line is ever reached. It’s like a freeze-frame for your app’s logic, so you can catch bugs in the act.
Android Studio Debugging Tips: Quick Debugging Tools & Shortcuts:
Sometimes a few handy tools are all you need. Here’s a quick reference:
| Debugging Tool | Purpose | Shortcut (Windows) |
|---|---|---|
| Logcat | View real-time logs | Alt + 6 |
| Breakpoints | Pause code at specific line | Ctrl + F8 (toggle) |
| Profiler | Analyze CPU/memory usage | (Open via Profiler tab in Android Studio) |
(Pro Tip: On Mac, use ⌘ instead of Ctrl for shortcuts like breakpoints, and ⌘+6 for Logcat.)
Android Studio Debugging Tips 2: Step Through Your Code (Step Over/Into)
Once your app pauses at a breakpoint, it’s time to step through the code. Android Studio provides controls to go through execution line by line:
- Step Over (F8): Move to the next line in the current function. Use this to go line-by-line without diving into function calls.
- Step Into (F7): If the next line calls a function, this will jump inside that function so you can debug it step by step. Great for inspecting deeper logic.
- Step Out (Shift+F8): If you’ve stepped into a function and want to jump back out to the caller, use this. It resumes execution until the current function returns.
- Resume (F9): Continue running until the next breakpoint (or the app ends).
Use these to walk through your code’s flow. For example, if you suspect a certain if block isn’t running, set a breakpoint before it and step over line by line to see if that code executes. If a function call might be the culprit, step into it to trace what’s happening inside. This step-by-step execution is like single-stepping through a puzzle – you’ll catch exactly where things go wrong.
While stepping, inspect the Variables panel (usually at the bottom left of the Debug window). You can watch values change in real time. If a variable is null when it shouldn’t be, you’ve found your bug! You can also add watches on specific variables or expressions (right-click a variable > “Add to Watches”) to track their values as you step through. Debugging is much easier when you see what your app sees at each moment.
Android Studio Debugging Tips 3: Master Logcat Like a Pro
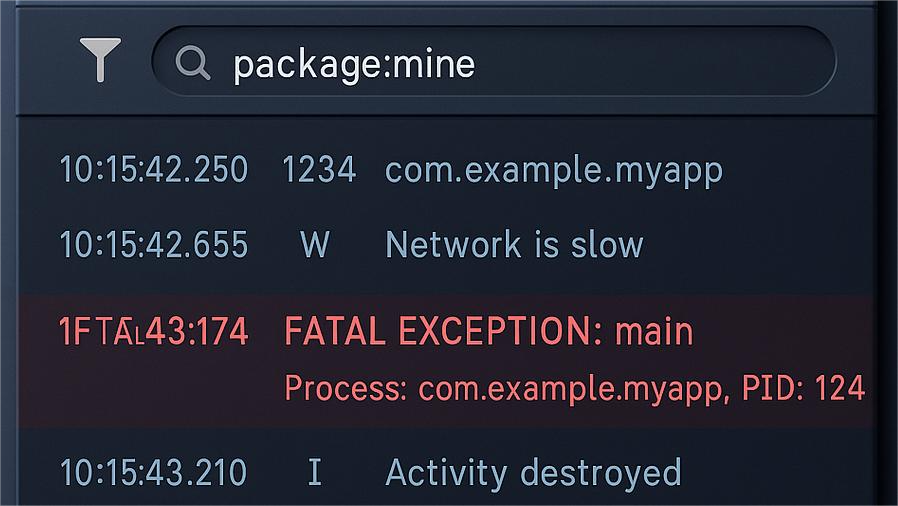
Screenshot: The Logcat window in Android Studio, filtering logs with package:mine to show only your app’s output.
When your app crashes or throws errors, Logcat is your best friend. The Logcat window in Android Studio displays real-time logs from your device or emulator. Every time you Log.d() or your app encounters an exception, it’ll show up here with details.
How to use Logcat effectively:
- Open Logcat: Click the Logcat tab at the bottom of Android Studio (or press Alt+6). If you don’t see it, go to View > Tool Windows > Logcat.
- Filter to your app: By default, Logcat can be noisy with system logs. Use the filter dropdown to show only your app’s logs. A quick trick is to type
package:minein the Logcat search bar – this filters logs to just the currently running app’s package. No more hunting through endless messages! - Look for the red text: Crashes are usually logged as FATAL EXCEPTION errors in red. When you see red text in Logcat, that’s your crash. Click it to expand the stack trace. The stack trace is the list of function calls that led to the error, with the cause at the top. It often includes the file and line number of the error (e.g., NullPointerException in MainActivity.java:34). This is gold it tells you exactly where and why the crash happened.
- Use log levels and tags: Logcat labels each entry with a level (Verbose, Debug, Info, Warn, Error, Assert). Use the level filter (the icons [V,D,I,W,E]) to focus on errors or warnings when debugging crashes. You can also search by tag or keyword. For instance, if you log custom messages with
Log.e("MyTag", "Something broke"), you can filter by MyTag to see those easily.
By mastering Logcat, you turn a firehose of information into a laser-focused debug tool. It’s your app’s diary of events – read it to find clues about crashes, performance issues, or any unexpected behavior.
(Pro tip: When an app throws an exception, Logcat shows the error and the stack trace with clickable links to your code. Use those links to jump straight to the offending line!)
Tip 4: Use Logging (Log.d) to Track Values
Sometimes you need to gather clues without pausing the app. This is where logging comes in. By sprinkling a few Log statements in your code, you can print out values and execution points to Logcat while the app runs at full speed. It’s a bit like leaving breadcrumbs for yourself.
How to log: Use the Log class methods to print messages:
Log.v(Verbose),Log.d(Debug),Log.i(Info),Log.w(Warn),Log.e(Error).
Each has a priority level; in Logcat, they’ll show in different colors (Verbose: black, Debug: blue, Info: green, Warn: orange, Error: red). For debugging,Log.dorLog.eare common –Log.efor errors you want to flag prominently,Log.dfor general debug info.
Example: Suppose you’re not sure if a function is being called or what a variable’s value is at runtime. Add:
kotlin:
Log.d("MY_APP", "Reached uploadData(), userId=" + userId);
This will print a line to Logcat like:D/MY_APP: Reached uploadData(), userId=42
Now you can run the app normally (not even in debug mode) and watch Logcat. If you see “Reached uploadData()” you know that code executed, and you’ll know the userId at that moment. If it never appears, the code path isn’t running.
Use logging wisely: Don’t go overboard and log everything; that can create noise and slow the app. Focus on key variables or decisions. And remember to remove or turn off verbose logs in production builds (you can use build config flags to only log in debug builds). Logging is especially useful for debugging lifecycle events, background services, or loops where using the debugger might interfere with timing.
One more trick – Android Studio’s Run window also shows basic logs when you run the app. But the Logcat window is more powerful for filtering. So get comfortable with Log.d and friends; it’s a simple yet powerful tool in your debugging arsenal.
Tip 5: Understand the Stack Trace (Read Error Messages)
When an app crashes, Android often provides a stack trace (the big blob of text in Logcat or the Run console when things go bad). It may look intimidating, but it’s incredibly useful once you know how to read it. A typical stack trace might start with something like:

How to read this:
- The first line tells you the exception type (e.g.,
NullPointerException) and a description. That’s the crash cause – here, probably trying to use an object that wasn’t initialized (null). - The next lines (“at …”) show the sequence of calls. Focus on the ones from your app’s package (com.example.myapp). In the example above,
MainActivity.java:56is highlighted – that’s likely where the null object was used. Android OS framework calls (like Activity.performCreate) are usually below; they’re not the source of the bug, just the system calls leading up to it. - Sometimes you’ll see a “Caused by:” in the stack trace. This is super important. It might indicate the root cause exception if one exception led to another.
Understanding stack traces is key to quick debugging. It’s basically the app telling you “I crashed because of X at this line”. So when you get a crash, read the error message and stack trace carefully. Copy the main error text (e.g., “Attempt to invoke virtual method on a null object reference”) and search it – chances are someone on Stack Overflow asked about it. Often, specific error messages have well-known solutions.
Real-world example: If you see
NullPointerExceptionatMainActivity:56, open that file and see what’s on line 56. Maybe you’re callingmyTextView.setText()butmyTextViewis null. That meansfindViewByIdfor it wasn’t called or returned null. Aha! Now you know to initialize that view or check yoursetContentView. This way, the stack trace has led you straight to the bug.
Tip 6: Use the Android Studio Profiler for Performance Bugs
Not all bugs are crashes; some are performance issues (e.g., your app is stuttering or using too much memory). Android Studio’s Profiler is the tool for those. It helps you track CPU usage, memory allocation, network requests, and more in real-time.
To open the Profiler, either click the Profiler tab at the bottom (usually next to Logcat) or go to View > Tool Windows > Profiler. Run your app and select the device in the Profiler. You’ll see graphs for CPU, Memory, Network, and Energy. Here’s how you can use it:
- CPU Profiler: Identify if some function is chewing up the CPU. You can record a method trace to see which methods are most expensive. For example, if your app lags during a certain action, start a recording, perform that action, then stop – the CPU profiler will show what functions took the most time.
- Memory Profiler: Great for finding memory leaks or excessive memory use. Watch the memory graph as you navigate your app. If it continuously climbs and never comes down, you might have a leak. You can force garbage collection in the profiler to see what memory gets freed. Also, take heap dumps to analyze what objects are in memory.
- Network Profiler: If your app uses networking (API calls, downloads), this shows the data sent/received and timing. Useful to debug slow network calls or unexpected data usage.
- Energy Profiler: Useful if you’re debugging battery drain or want to see if some code is keeping the device awake (common for background work).
Using the Profiler, you might discover that a particular screen causes a huge spike in CPU or memory – indicating inefficient code or leaks on that screen. Or find that a network call is taking too long due to large responses.
For beginners, the Profiler might seem advanced, but don’t shy away. Even a quick look can reveal obvious issues (like memory shooting up 100 MB when you open a screen). It’s visual and fairly intuitive: spikes and steady climbs = potential problems. The profiler essentially gives you X-ray vision into your app’s performance. If you’re interested, Android’s official docs have detailed guides on profiling tools – but even basic usage can help you fix sluggishness fast.
See Google’s Android Developers guide on profiling for deeper dives into each profiler tool.
Tip 7: Inspect Your UI with Layout Inspector
UI glitches or layout issues can be tricky to debug by just reading XML. Android Studio’s Layout Inspector (and the newer Layout Validation tool) can help you debug what’s happening on the screen.
When to use it: If a view isn’t showing, or looks wrong (misaligned, the wrong size, etc.), or you’re not sure what the current UI state is, the Layout Inspector is clutch. It lets you inspect the live UI hierarchy of your app on a device/emulator.
How to use Layout Inspector:
- Run your app on a device or emulator.
- Go to Tools > Layout Inspector (or View > Tool Windows > Layout Inspector). If using Android Studio Electric Eel or later, you can also use Layout Inspector (Live).
- Select your device and the app process. You’ll see a tree view of all your UI components (Views), and a screenshot preview. You can click on any view in the tree or the preview and see its details (attributes, size, margins, etc.).
This is super helpful to find invisible layout problems. For example, if a Button isn’t responding, maybe another view is overlaying it. The inspector would show that overlapping view. Or if a TextView shows wrong text, you can see what text property it has at runtime. It even highlights margin/padding and can display a 3D view of how layers are arranged (in recent Android Studio versions).
Also try Layout Validation (under Tools > Layout Validation) if you want to see how your layout appears on different screen sizes and devices at once. It’s more for design, but can catch issues that only appear on certain screen configurations.
In summary, the Layout Inspector is like a debugger for your UI. It lets you peek behind the curtain of your app’s interface. Instead of guessing why “that view is missing”, you can directly see if it’s present, what its size is, and who its parent is. A lot of “UI bugs” turn out to be layout issues (view is there but off-screen or obscured). This tool will help you root cause those visually.
Tip 8: Clean, Rebuild, and Clear Caches (When in Doubt)
Sometimes the bug isn’t in your code at all – Android Studio or Gradle just had a hiccup. We’ve all experienced those “It compiles on my machine” or weird errors that go away on their own. If you’re seeing strange behavior or errors that don’t make sense (especially after major changes), it might be time to try the classic turn-it-off-and-on approach for your project:
- Clean Project: Go to Build > Clean Project. This will delete the compiled files, forcing a fresh rebuild next time. It often fixes issues where old build artifacts cause conflicts.
- Rebuild Project: After cleaning, do Build > Rebuild Project. This ensures everything is compiled from scratch. Useful if you suspect something didn’t compile or integrate correctly.
- Invalidate Caches & Restart: Under File > Invalidate Caches / Restart…. This clears Android Studio’s internal caches (like indices). Sometimes the IDE gets confused (for example, showing errors that aren’t real). Restarting with caches invalidated can solve bizarre issues with code completion, layout previews, or builds.
Use these as a last resort for puzzling problems. For instance, if you added a library but Android Studio acts like it’s not there, a rebuild might help. Or if you run an app but it’s not picking up the latest code changes, cleaning can ensure you’re not running stale code. Just yesterday, we encountered a situation where an app kept crashing even after the code was “fixed” – turns out an old version was somehow still running. A rebuild fixed that in a jiffy.
Also, keep your Gradle and SDK tools updated, but be cautious updating in the middle of a big project without reason. Environment issues can masquerade as code bugs. So if something truly strange is happening, a clean/rebuild or even deleting the build/ folder manually can sometimes do wonders.
Tip 9: Test on Real Devices (Not Just Emulators)
Emulators are super convenient, but they aren’t perfect copies of every device. A bug that occurs on a real phone might not show up on the emulator (or vice versa). For example, you might have a feature that works great on the emulator’s fake camera, but crashes on a real device’s camera. Or performance could be fine on your powerful PC running the emulator, but slow on an actual low-end phone.
Why real devices matter: They have different performance characteristics, hardware features, and quirks. Things like sensors, phone call interruptions, specific manufacturer modifications (OEM skins), or even Android OS bugs can surface only on hardware.
Debugging on device: Android Studio makes it easy – just enable USB debugging on your phone (and authorize your PC), then plug it in. It will show up in the device list. You can use all the same debugging tools (breakpoints, Logcat, profiler) on a physical device just like the emulator. Sometimes, you’ll catch errors in Logcat on a device that never appeared on the emulator’s Logcat.
Also test on different API levels and screen sizes if you can, because an app might crash on Android 13 but not on Android 11, for example, due to API changes. The emulator can help with different Android versions, but real devices often have different memory and CPU profiles.
At the very least, before you ship or finalize your app, run it on a physical device to see if everything behaves as expected. It can save you from “but it worked on my emulator!” moments. Many developers have learned that lesson the hard way (myself included!). So when in doubt, connect a real phone or tablet and give it a whirl – you might uncover device-specific issues that you can then fix proactively.
Tip 10: Leverage Stack Overflow and Documentation (Community Help)
Remember, you’re not alone in this debugging journey. We all get stuck, and chances are someone else has encountered (and solved) the exact problem you’re facing. Two invaluable resources for any Android developer are Stack Overflow and the official Android Developer Documentation.
Stack Overflow: When you hit a perplexing error or bug, search for it verbatim (e.g., “java.lang.NullPointerException setText on null object Android”). Often, the top results are Stack Overflow threads where experts have explained the cause and solution. Look for answers with lots of upvotes and a checkmark (accepted answer). For example, if your app crashes when fetching data from an API, searching the error message might reveal a common fix (maybe you did network on the main thread or forgot a permission). Don’t just copy-paste code blindly, but use the insights to guide your fix. The discussions on these threads can also teach you a ton about Android quirks.
Official Documentation: Google’s Android Developer site has extensive guides. If you’re dealing with, say, a Firebase crash or an SQLite database issue, the docs often have a section that covers it. When a new Android Studio version changes something (like the new Logcat in Android Studio Dolphin in 2023), the release notes or docs will explain how to use it. The official docs are also great for best practices – for instance, how to properly handle background tasks, or how to use new debug features. Checking the docs can sometimes reveal you’re using an API incorrectly.
Communities and Forums: Aside from Stack Overflow, communities like Reddit (r/androiddev), Android Forums, and even medium blogs can offer solutions. If truly stumped, you can ask a question on Stack Overflow yourself – just provide details and what you’ve tried. The Android dev community is huge and usually helpful if you’ve done a bit of homework.
Lastly, Android Studio itself is improving with tips – for certain exceptions, Logcat might even show a link “Open documentation” or suggestions. Pay attention to those hints.
Bottom line: Don’t reinvent the wheel. Leverage the collective knowledge out there. A five-minute search can save you five hours of banging your head on the keyboard. Over time, you’ll remember common fixes and become the one answering others’ questions!
Debug Smart, Debug Calm
Debugging is a skill – one that gets better with practice. As a beginner, it might feel like you’re putting out fires more than building features. But with these tips, you now have a firefighter’s toolkit. We went through using breakpoints and the debugger to pause at will, stepping through code to trace logic, wielding Logcat to catch those red errors in action, and even busting out advanced tools like the Profiler and Layout Inspector for the tougher bugs. We also covered the not-so-obvious stuff: when to clean/rebuild your project, when to test on a real device, and how to tap into the wisdom of the developer community.
Stay patient and curious. The key to debugging is staying calm and methodical. Instead of seeing a crash as a defeat, view it as your app telling you exactly what needs fixing. Every bug you solve makes you a better developer because you learn something. And hey, you’re not alone – we’ve all rage-quit the Android emulator at 2 AM at some point! But the difference now is you have a game plan to follow.
So the next time your app crashes or misbehaves, take a deep breath and tackle it step by step with the tools and techniques we discussed. You’ve got this! Happy coding, and may all your bugs be shallow.
FAQ (Frequently Asked Questions)
Q1: My Logcat is empty or I don’t see any logs. What do I do?
A: This is a common frustration. First, make sure your app is actually running in Debug mode. If you run it normally, some logs (especially from Log.d) might not show depending on filters. In Logcat, ensure no filter is hiding your logs – set the dropdown to your app’s package or “Show All”. Also check that the log level isn’t set too high (e.g., if it’s showing only Errors, you won’t see Debug logs). If Logcat is completely blank, try the trick: press Alt+6 twice – this can restart the Logcat window in Android Studio (it’s a weird but effective workaround). Lastly, if connected to a device, ensure USB debugging is enabled and the device is selected. In some cases, unplugging and re-plugging the device, or restarting Android Studio, fixes a stuck Logcat.
Q2: What is a NullPointerException and how do I fix it?
A: A NullPointerException (NPE) is when your code tries to use an object reference that is null (not initialized). It’s like trying to start a car that has no engine – the app doesn’t know what to do, so it crashes. To fix it, find out why that object is null. Common causes for NPE in Android: forgetting to findViewById() for a UI element before using it, not initializing a variable, or using an object that’s only set in a certain lifecycle method (e.g., using an Activity context in a fragment before onAttach). The stack trace will tell you which line threw the NPE. Go to that line and add some defensive code: check for null, or ensure the object is properly created. For example, if myTextView is null at onCreate, make sure you called myTextView = findViewById(R.id.my_text) after setContentView. NPEs are usually easy to fix once you identify the variable that’s null.
Q3: My app is running extremely slow. How can I figure out what’s wrong?
A: If your app is sluggish or stuttering, first determine if it’s a specific action or screen causing it. Use the Profiler (Tip 6) to see CPU usage or memory spikes during the slow period. If you see a huge CPU spike, it might be some heavy computation on the main thread – consider offloading it to a background thread or optimizing the algorithm. If memory shoots up, you might be loading too much data at once or leaking objects (e.g., not clearing resources). Also, check Logcat for GC (Garbage Collection) messages. Frequent GC messages (often labeled “GC_for_alloc” in Logcat) mean the app is thrashing memory. That could cause jank. On the UI side, inspect your layout – complex view hierarchies or deep nesting can slow down rendering. Tools like Layout Inspector or Layout Hierarchy in the Android Device Monitor can show how heavy your UI is. Lastly, consider using StrictMode (an Android tool that can highlight slow operations, like disk or network access on the main thread). Enabling StrictMode (during development) will log warnings if you’re doing something expensive on the UI thread. In short, pinpoint the source (CPU, memory, I/O) and then address accordingly: optimize code, use background threads, recycle objects, or simplify the UI.
Q4: What’s the difference between Run and Debug in Android Studio?
A: When you Run (the green play button), Android Studio simply builds your app and launches it. When you Debug (the bug icon or Shift+F9), it does the same but also attaches the debugger to the app process. Attaching the debugger allows breakpoints to work, and it makes the app wait/pause when you hit one. In debug mode, the app runs a tad slower and with additional overhead because it’s allowing all that inspection (that’s why you typically don’t ship apps in “debug mode”). Also, the debugger will show logging from the app more verbosely and will let you inspect threads, etc. If you run normally, you can still see Logcat logs, but you can’t pause execution or inspect variables. Another difference: when you run with Debug, the build uses a debuggable build variant (with debuggable=true) which includes extra info (like source code line mapping) needed for debugging. In summary: use Run for quick launch and testing, but use Debug when you need to troubleshoot and step through code.
Q5: My app isn’t hitting my breakpoint. Why could that be?
Q5: My app isn’t hitting my breakpoint. Why could that be?
A: There are a few possibilities:
- (1) The code with the breakpoint isn’t being executed – double-check your app’s flow to ensure that section runs. Perhaps the function isn’t called, or a condition prevents it. Try moving the breakpoint to an earlier point or another method to see if anything hits.
- (2) You’re running in normal mode, not debug mode – remember, breakpoints only work when you launch the app with the Debug option. If you hit the regular Run, the app won’t stop at breakpoints. So always click the bug icon or use Attach Debugger if the app is already running.
- (3) Breakpoint is in code that runs on a different process or too early: For example, breakpoints in
Application.onCreateor in library modules might be tricky if they happen before the debugger attaches. In such cases, you could add a temporaryThread.sleep()to delay execution, or use “Attach debugger to Android process” after the app launches. (4) Proguard/Minification: If you’re debugging a release build with minification, the code might be optimized in ways that don’t match line-by-line. Always debug with a non-minified debug build. Usually by default, the “app” configuration is already a debug build. Finally, make sure Instant Run/Apply Changes isn’t causing confusion – sometimes it can inject code changes without a full restart, and breakpoints might behave oddly. If you suspect that, do a cold restart of the app under the debugger. In most cases, if you launch with the debugger and the code is executed, the breakpoint will hit. If not, it’s a sign to investigate if that code path is running as expected. Good luck!
Got questions or another tip to share? Drop a comment below. let’s learn from each other. Debugging is a team sport!
