Tune Performance
Unlock peak performance for your Android apps with our comprehensive performance tuning tutorials and tools. Start optimizing today!

Tune Performance
Our platform offers unparalleled performance tuning capabilities, ensuring your apps run smoothly, efficiently, and deliver exceptional user experiences every time.
Profiling Tools
Frame Rates
Memory Leaks
Battery Optimization
Learn Tuning




Learn Tuning
Our platform offers unparalleled performance tuning capabilities, ensuring your apps run smoothly, efficiently, and deliver exceptional user experiences every time.
Our Process
We start by understanding your app's specific needs and performance goals, ensuring a tailored optimization strategy.
Our experts conduct thorough profiling and analysis to identify performance bottlenecks and areas for improvement.
We continuously monitor and analyze performance metrics, making iterative adjustments to maintain optimal efficiency.
Key Benefits
Our advanced profiling tools provide real-time insights into CPU usage, memory allocation, network activity, and battery consumption, enabling precise optimization strategies.



Our Services
We offer a range of services designed to optimize your Android apps for peak performance and efficiency.
Explore fresh insights and expert tutorials on Android coding and architecture. From mastering Kotlin and Jetpack Compose to implementing scalable MVVM patterns, these articles help you build robust apps, design intuitive UIs, and debug with confidence.


Android performance tuning refers to the process of optimizing your app’s speed, responsiveness, memory usage, and battery efficiency. It involves profiling your app, identifying bottlenecks, and applying best practices to ensure smooth user experiences across devices.
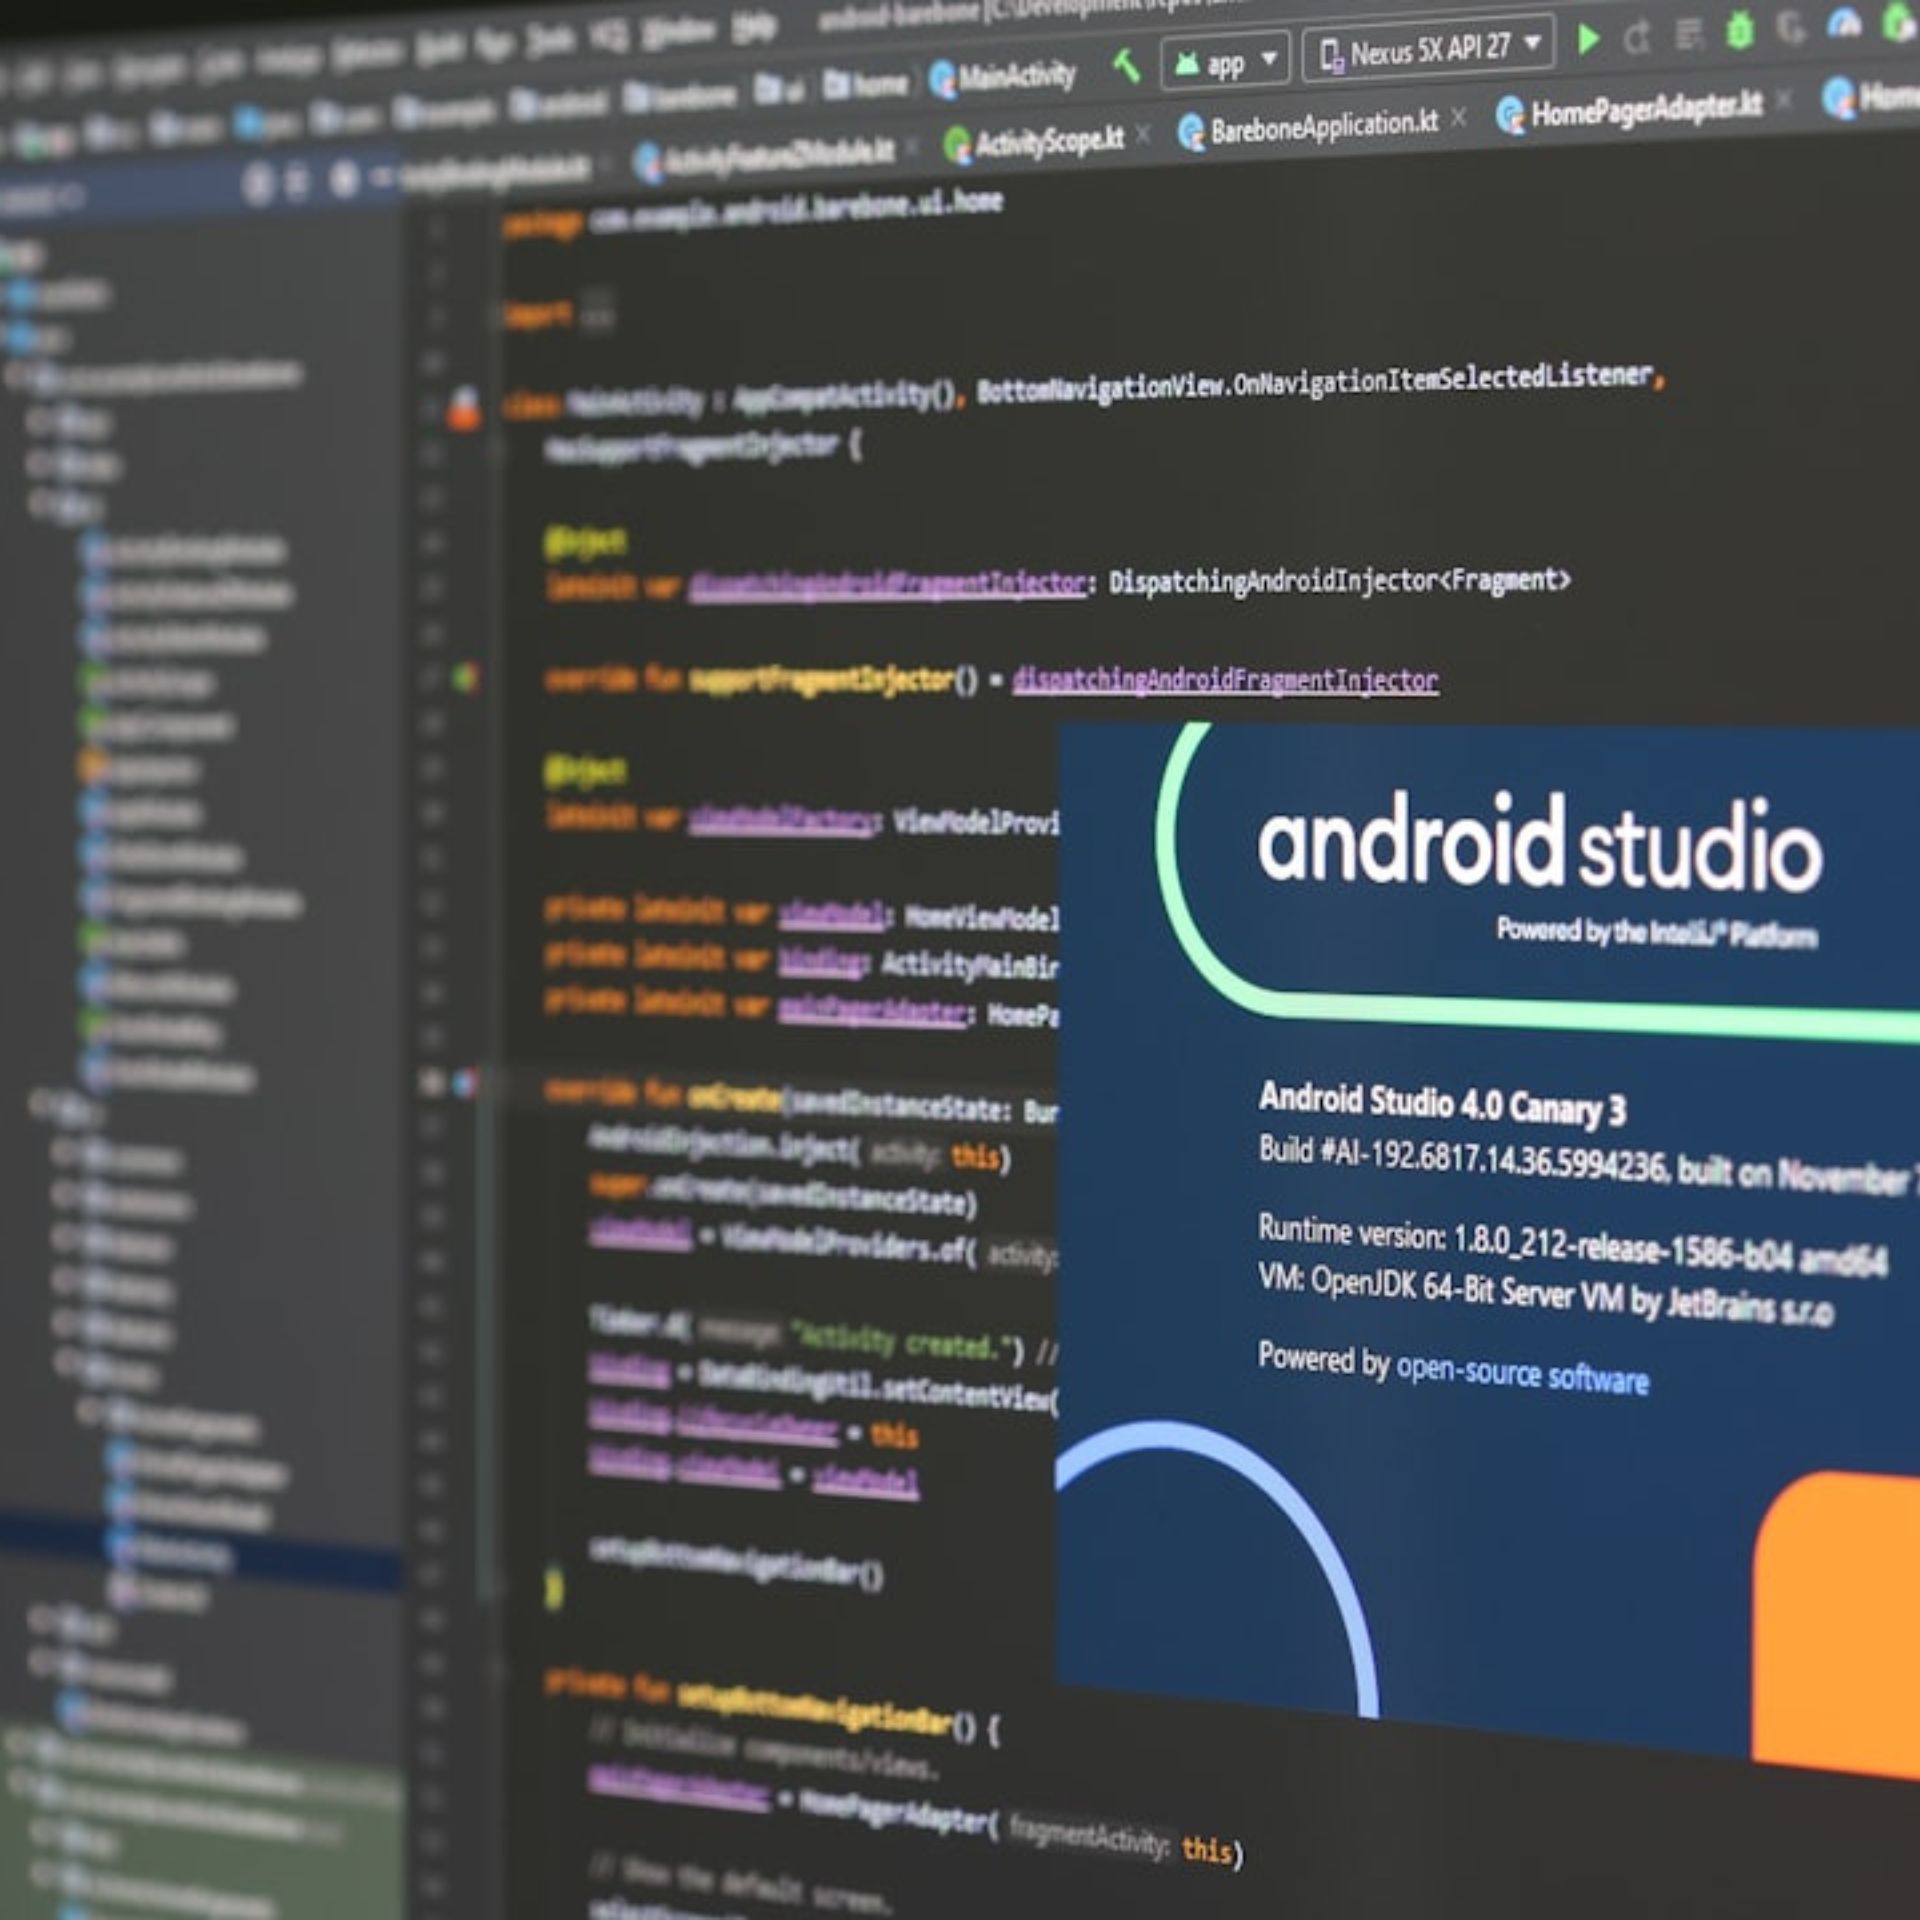
Use tools like Android Profiler, Systrace, and CPU/GPU rendering analysis in Android Studio. These tools help you monitor frame rates, memory leaks, thread usage, and overdraw issues to pinpoint areas that slow down your app.
Common issues include:
Unoptimized layouts (e.g., nested views)
Excessive memory allocation or leaks
Blocking the main thread with heavy operations
Inefficient RecyclerView usage
Overdraw and redundant rendering
Minimize background tasks, use JobScheduler or WorkManager for deferred work, reduce wake locks, and avoid frequent location updates. Profiling with Battery Historian helps identify power-hungry components and optimize them.
We’re a team of passionate tech writers helping developers, marketers, and privacy-conscious users navigate the digital world. From mobile development to AI and SEO, our goal is to deliver clear, actionable insights.
© 2026, Android Studio Hub. All Rights Reserved.